Predictive Analysis of Methylation Patterns in Oral Squamous Cell Carcinoma (OSCC) Using Machine Learning
Abstract
Introduction
Oral and oropharyngeal cancers are the most common types of head and neck cancers, with over 90% originating from squamous cells in the mouth and throat. Chronic tobacco and alcohol use, inflammation, viral infections, betel quid chewing, and genetic predisposition are major risk factors for OSCC, which kills over 100,000 patients annually. Epigenetic mechanisms, such as DNA methylation, can silence tumor suppressor genes, contributing to cancer progression and patient outcomes in Oral Squamous Cell Carcinoma (OSCC). This study aimed to predict prominent methylation signatures that can distinguish OSCC from normal cells.
Methods
Machine learning algorithms, like Support Vector Machine (SVM), Random Forest (RF), and Multilayer Perceptron (MLP), were implemented using R packages and a balanced training dataset consisting of M-values of methylated CpG sites from 46 matched OSCC and normal adjacent tissue samples.
Results
MLP model demonstrated the highest accuracy of 92% on the training dataset and 100% on the blind dataset, even with a reduced feature set of just 10 significantly differentially methylated CpG sites.
Discussion
Despite the high burden of oral cancer in South America, and an alarming trend of rising number of cases, research into this particular area is sorely lacking. This work aims to address the issue by performing a machine learning-based analysis of methylation patterns, a major established factor, in oral cancer datasets obtained from Brazilian patients. However, the lack of experimental evidence supporting the results of this analysis can be considered a significant limitation of this study.
Conclusion
A highly accurate and generalizable machine learning model was developed using the Multi-layer Perceptron with multiple layers (MLP-ml) algorithm, which achieved an accuracy of 95% on an independent validation dataset of 15 OSCC tumors and 7 non-tumor adjacent tissue samples. Machine learning algorithms can therefore provide valuable insights into biological datasets that may be overlooked by regular bioinformatics workflows.
1. INTRODUCTION
Oral and oropharyngeal cancers are the two most common types of cancer that develop in the head and neck region, and more than 90% of these cancers originate from the flat, scale-like squamous cells found in the lining of the mouth and throat. After initiation, tumour cells can deeply invade the local structures and lymph nodes of the neck, leading to further distant metastases even into the aero-digestive tract of the patients, all of which increases the chances of potential recurrence of oral cancers [1]. Epigenetic mechanisms that result in dysregulation of gene expression have been found to play a major role in OSCC [2], which claims the lives of more than 100,000 patients worldwide every year [3]. Chronic tobacco and alcohol use, which can have a direct impact on epigenetic regulation of gene expression, constitute two major risk factors for OSCC tumorigenesis, along with other prominent factors like chronic inflammation, viral infections (human papillomavirus or HPV), betel quid chewing, and genetic predisposition [4, 5]. It is, therefore, of critical importance to understand the role of epigenetic alterations, like aberrant DNA methylation, in the initiation and progression of OSCC.
DNA methylation is a key epigenetic modification that can silence tumour suppressor genes, contributing to the development and subsequent progression of different types of cancers, including breast, lung, colon, and ovarian cancers [6-8]. DNA methylation alterations, such as hypermethylation of tumour suppressor genes, are commonly observed in OSCC, and are known to influence cancer progression and patient outcomes [9]. In addition, increased expression of DNA Methyltransferases (DNMTs) is often observed in oral cancers, leading to gene inactivation and chromosomal instability [10]. DNMT are enzymes that catalyze DNA methylation and play a role in its initiation and maintenance. After DNA replication, DNMT1 is responsible for transferring methylation patterns to the newly-synthesized DNA strand [11]. Conversely, DNMT3A and DNMT3B participate in de novo methylation [12, 13]. Nevertheless, it has been demonstrated that in addition to DNMT1, DNMT3A and DNMT3B are also necessary for the creation and maintenance of methylation patterns [14]. Ten Eleven Translocation (TET) proteins, on the other hand, inhibit DNMT activity. Cytosines can be demethylated by TET1, TET2, and TET3 via a sequence of reactions, oxidizing 5-methylcytosine to 5-hydroxymethylcytosine [15]. Furthermore, research suggests that Thymine DNA Glycosylase (TDG) and Activation-Induced Cytidine Deaminase (AICDA) are also involved in the demethylation process [16, 17]. Interestingly, HPV oncoproteins E6 and E7 can interfere with the activity of DNMTs, which can lead to changes in methylation patterns across the host cell genome, further emphasizing the potential role of oncogenic HPV infection in inducing OSCC [18]. Epigenetic drugs like DNA methyltransferase-1 (DNMT1) inhibitors have shown promise in cancer treatment by modulating aberrant DNA methylation patterns [19]. Targeting DNA methylation through DNMT inhibitors may, therefore, offer a novel therapeutic strategy against OSCC [20].
In general, it has been observed that global DNA hypomethylation contributes to the process of OSCC tumorigenesis through multiple potential mechanisms, including the reduction of methylation at DNA repetitive elements leading to chromosomal instability and the demethylation of some methylation-silenced promoter regions of proto-oncogenes. Furthermore, specific methylation patterns have been associated with tumor differentiation and nodal involvement, leading to Differentially Methylated Regions (DMRs) being recognized as potential biomarkers for early detection and prognosis in oral cancer, with specific genes like DAPK1 and TIMP3 showing significant associations with clinical outcomes [21].
Machine learning algorithms, such as Support Vector Machine (SVM), Random Forest (RF), and Artificial Neural Network (ANN), might play a crucial role in the identification of prominent methylation signatures that can distinguish OSCC from normal cells by rapid analysis of the high-dimensional datasets typically produced by genome-wide DNA methylation studies. Machine Learning (ML) is a branch of Artificial Intelligence (AI) that is deeply rooted in applied statistics, building computational models that use inference and pattern recognition instead of explicit sets of rules. ML focuses on developing computer systems that learn from data and progressively improve their predictive performance, and therefore, can be very efficient in detecting patterns embedded in high-dimensional datasets that might not be explicitly defined and discernible by humans as such machine learning techniques have become fairly popular among biomedical researchers to study methylation patterns associated with various types of cancers including OSCC [22-27].
Despite the highest incidence being in Asia, followed by Europe and North America, with a disproportionately high disease burden in Low- and Middle-Income Countries, South America, particularly Brazil, also has high incidence rates of oral and oropharyngeal cancers, which are unfortunately underreported and largely overlooked by the global research community. In this article, machine learning approaches were utilized to predict methylation patterns associated with OSCC using two separate Brazilian datasets. Although a few studies have employed machine learning for decoding methylation patterns in diseases like Tuberculosis and Chagas Cardiomyopathy, this is the first report of machine learning being used on a cancer methylome dataset from South America. [28, 29].
2. MATERIALS AND METHODS
2.1. Study Design
The research question addressed in this study was whether machine learning-based predictive analysis is capable of identifying distinctive patterns of methylations in OSCC vs. normal tissue specimens. This is an analytical study carried out using quantitative methods on a set of Brazilian OSCC patients, who served as the study population, whose DNA methylation profiles were made publicly available through the Gene Expression Omnibus (GEO) database.
2.2. Dataset Description
2.2.1. Training Dataset
The dataset GSE234379 was downloaded from the GEO, a public functional genomics data repository available through the National Center for Biotechnology Information, funded by the government of the United States. This dataset consists of DNA methylation data from 46 matched OSCC and adjacent normal tissue samples collected from patients at A.C. Camargo Cancer Center, Sao Paulo, Brazil, run on a genome-wide platform (Illumina Infinium HumanMethylation450 BeadChip) [30].
2.2.2. Independent Dataset
The dataset GSE178216, containing genome-wide methylation data from 7 non-tumor adjacent tissues and 15 tumors from OSCC patients at the Brazilian National Cancer Institute (INCA, Rio de Janeiro, Brazil) in Illumina Infinium HumanMethylation450 BeadChip, was used as the independent validation dataset [31].
2.3. DNA Methylation Analysis
DNA methylation analysis was performed using the R Bioconductor package ‘minfi’ (version 1.54.1) [32], wherein Beta values (proportion of methylation at a specific CpG site) and M-values (log-ratio of methylation) for each probe across samples were determined from the raw IDAT files in the dataset, after pre-processing using Noob (normal-exponential out-of-band), a background correction method with dye-bias normalization. Beta values and M-values are two commonly used measures to represent methylation levels, with the caveat that Beta values are more suitable for visualization and clustering, while M-values are better for statistical modeling and differential methylation analysis. This is because M-values have better statistical properties, such as more homoscedasticity (homogeneity of variance/variance does not depend on the mean), which also aligns better with assumptions in most machine learning algorithms. Studies have also shown that M-values often lead to better model accuracy and feature selection performance, and machine learning algorithms typically benefit from the unbounded, more Gaussian-like distribution of M-values. Additionally, the log-ratio nature of M-values helps highlight subtle but consistent changes, making them more useful for pattern recognition in classification tasks. Hence, a final set of 67 M-values, which were retained after filtering out the rows with missing values or no variation, was chosen as the input dataset for the machine learning algorithms described in the next section.
Packages like ‘limma’ (v. 3.64.1) [33], ‘IlluminaHumanMethylation450kanno.ilmn12.hg19’ (v. 3.21), ‘DMRcate’ (v. 3.4.0) [34], and ‘ChIPseeker’ (v. 1.44.0) [35], were used for Differential Methylation Analysis, annotation and identification of Differentially Methylated Regions (DMRs), and subsequent DMR analysis, comparison, and visualization, respectively.
2.4. Machine Learning
The following machine learning algorithms were implemented using the caret (version 6.0-94) package in R [36]: (a) Naïve Bayes (NB), (b) Support Vector Machines with Linear Kernel (SVM-linear), (c) Support Vector Machines with Radial Basis Function Kernel (SVM-radial), (d) Bagged Classification and Regression Trees (treebag), (e) gradient boosting model using decision trees via XGBoost (xgbTree), (f) Random Forest (RF), and (g) Multi-Layer Perceptron, with multiple layers (MLP-ml). Naïve Bayes is a probabilistic classifier based on Bayes’ theorem with the naive assumption that all features are independent and follow a Gaussian distribution. Support Vector Machines (SVMs) are powerful supervised learning algorithms that try to find the optimal hyperplane that best separates data points from different classes by maximizing the margin between them. Bagging stands for Bootstrap Aggregating, and is an ensemble method that creates multiple bootstrap samples (random samples with replacement) from the training dataset. The 'treebag' method in caret refers to a bagging ensemble of decision trees, often known as Bagged CART (Classification and Regression Trees). The xgbTree method in the caret package trains a gradient boosting model using decision trees as base learners, which is implemented via the XGBoost library. This library sequentially builds trees where each new tree attempts to correct errors made by the previous ones. Random Forest is an ensemble of decision trees built using Bagging (Bootstrap Aggregation) and Random Feature Selection, where a large number of trees are built and their predictions are aggregated to produce a more accurate and robust model. A Multi-Layer Perceptron (MLP) is a type of feed-forward artificial neural network, and the 'Multi-Layer Perceptron with Multiple Layers' method supports multiple hidden layers, using the RSNNS (Stuttgart Neural Network Simulator) backend.
In each of these methods, 80% of the dataset was used as training data for 5-fold cross-validation, while the remaining 20% was used as the blind/test dataset for model evaluation. During 5-fold cross-validation and model evaluation, several threshold-dependent and threshold-independent performance metrics were used [37]. The ‘pROC’ (version 1.18.5) package was used for plotting the Receiver Operating Characteristic (ROC) curves [38].
3. RESULTS
The dataset GSE234379, comprising genome-wide DNA methylation data from 46 matched oral cavity cancer and adjacent normal tissue samples generated using the Illumina Infinium HumanMethylation450 BeadChip (450k), was downloaded from the GEO database, and analyzed using various R packages. Finally, a carefully filtered set of 67 M-values (representing 67 CpG sites) was used as input to train machine learning models using NB, SVM-linear, SVM-radial, treebag, xgbTree, RF, and MLP-ml algorithms (Fig. 1), as described in the Materials and Methods section. As shown in Table (1A and B), the MLP-ml model achieved the best accuracy score of 92% on the training set, and 100% on the blind dataset.
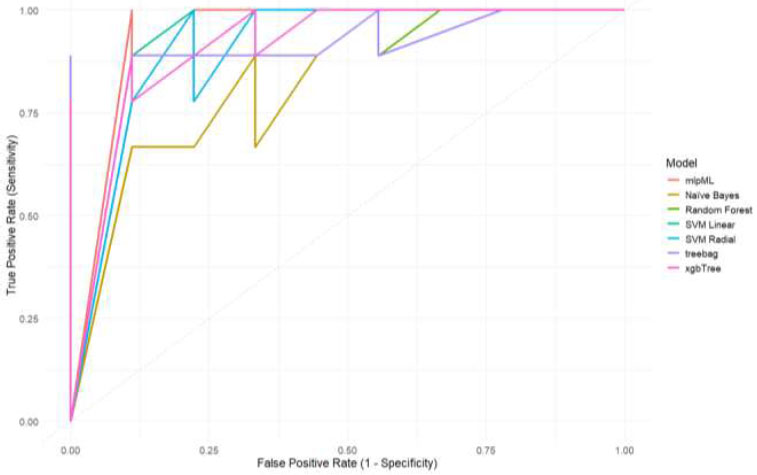
ROC curves for different ml models with true positive rate or sensitivity as the y-axis and false positive rate as the x-axis, respectively.
| - | logLoss | AUC | F1 | Sensitivity | Specificity | Precision | Recall | Accuracy |
|---|---|---|---|---|---|---|---|---|
| NB | 2.42 | 0.89 | 0.85 | 0.86 | 0.84 | 0.84 | 0.86 | 0.85 |
| svmL | 0.40 | 0.89 | 0.84 | 0.84 | 0.84 | 0.84 | 0.84 | 0.84 |
| svmR | 0.41 | 0.90 | 0.88 | 0.89 | 0.86 | 0.87 | 0.89 | 0.88 |
| treebag | 0.28 | 0.95 | 0.90 | 0.95 | 0.84 | 0.85 | 0.95 | 0.89 |
| xgbTree | 0.30 | 0.97 | 0.91 | 0.95 | 0.86 | 0.88 | 0.95 | 0.91 |
| RF | 0.29 | 0.97 | 0.91 | 0.95 | 0.86 | 0.88 | 0.95 | 0.91 |
| mlpML | 0.30 | 0.94 | 0.92 | 0.95 | 0.89 | 0.90 | 0.95 | 0.92 |
| - | logLoss | AUC | F1 | Sensitivity | Specificity | Precision | Recall | Accuracy |
|---|---|---|---|---|---|---|---|---|
| NB | 2.81 | 0.95 | 0.78 | 0.78 | 0.78 | 0.78 | 0.78 | 0.78 |
| svmL | 0.12 | 1.00 | 0.95 | 1.00 | 0.89 | 0.90 | 1.00 | 0.94 |
| svmR | 0.28 | 0.95 | 0.82 | 0.78 | 0.89 | 0.88 | 0.78 | 0.83 |
| treebag | 0.31 | 0.96 | 0.82 | 1.00 | 0.56 | 0.69 | 1.00 | 0.78 |
| xgbTree | 0.33 | 0.98 | 0.86 | 1.00 | 0.67 | 0.75 | 1.00 | 0.83 |
| RF | 0.25 | 0.98 | 0.90 | 1.00 | 0.78 | 0.82 | 1.00 | 0.89 |
| mlpML | 0.04 | 1.00 | 1.00 | 1.00 | 1.00 | 1.00 | 1.00 | 1.00 |
| - | logLoss | AUC | F1 | Sensitivity | Specificity | Precision | Recall | Accuracy |
|---|---|---|---|---|---|---|---|---|
| topmost_feature | 0.27 | 0.95 | 0.90 | 1.00 | 0.78 | 0.82 | 1.00 | 0.89 |
| top3_features | 0.03 | 1.00 | 1.00 | 1.00 | 1.00 | 1.00 | 1.00 | 1.00 |
| top5_features | 0.01 | 1.00 | 1.00 | 1.00 | 1.00 | 1.00 | 1.00 | 1.00 |
| top10_features | 0.00 | 1.00 | 1.00 | 1.00 | 1.00 | 1.00 | 1.00 | 1.00 |
| top15_features | 0.04 | 1.00 | 1.00 | 1.00 | 1.00 | 1.00 | 1.00 | 1.00 |
| top20_features | 0.08 | 1.00 | 0.94 | 0.89 | 1.00 | 1.00 | 0.89 | 0.94 |
| - | logLoss | AUC | F1 | Sensitivity | Specificity | Precision | Recall | Accuracy |
|---|---|---|---|---|---|---|---|---|
| GSE178216 | 0.11 | 1.00 | 0.93 | 1.00 | 0.93 | 0.88 | 1.00 | 0.95 |
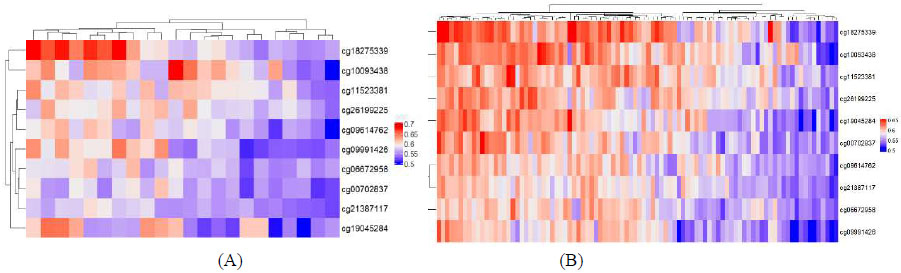
Heatmaps of beta values of the top 10 CpG sites detected via machine learning in (A) GSE234379, (B) GSE178216.
To further analyze the MLP-ml model, the number of features (CpG sites) used for prediction was sequentially reduced to determine the least number of features sufficient to develop a minimalistic model. As shown in Table 2, the best-performing minimalistic model used only the top 10 features to give an accuracy score of 100%. Table S1 lists the details of these top 10 CpG sites, including the summary test statistic for the DMR (from limma), mean difference in M-values across the DMR, p-value for the DMR before any correction for multiple testing, and FDR-adjusted p-value using the Benjamini-Hochberg method, along with the genomic co-ordinates and overlapping genes (if any).
The minimalistic MLP-ml model using only the top 10 CpG sites as features was also used to predict OSCC samples in an independent validation dataset GSE178216 consisting of 15 OSCC and 7 normal adjacent tissue samples, achieving an accuracy of 0.9545 [95% CI: (0.7716, 0.9988), P-Value 0.002469] and an AUC of 100%, as shown in Table 3. Fig. (2) shows heatmaps of Beta values of these top 10 CpG sites in the 2 datasets used in this study.
4. DISCUSSION
The incidence of oral cancer and corresponding mortality rates in South America is notably high [39], with Brazil reporting the highest rates among males [40]. The rising incidence rates, driven by factors such as tobacco and alcohol consumption, pose significant challenges for public health policy, necessitating targeted interventions to address the underlying risk factors and improve healthcare access. In the current study, 2 whole-genome methylation datasets originating from Brazilian hospitals were analyzed using machine learning algorithms to decipher specific methylation patterns associated with OSCC. The M-value (log-ratio of methylation for each probe) matrix of 485512 probes across 92 samples (46 OSCC tumors and 46 matched normal samples) was screened to remove rows with missing values or no variation, yielding a curated set of 67 CpG sites. This is a crucial pre-processing step because rows with NAs (missing values) can compromise statistical integrity or disrupt functions, while imputation of methylation values is challenging and can introduce bias, especially for high-dimensional, sparse data like methylation arrays. Removal of rows with zero variance, on the other hand, is intuitive because methylation sites with the same value in all samples cannot distinguish between the sample groups, thereby adding noise or redundancy, increasing model complexity without any benefit. No-variation sites are biologically uninformative and computationally inefficient, they inflate dimensionality without contributing to variance, possibly distorting results, and hence should be excluded.
Machine learning models from several methods, including NB, SVM-linear, SVM-radial, treebag, xgbTree, RF, and MLP-ml algorithms, were trained using the larger dataset (GSE234379), which is a balanced dataset of 46 OSCC and 46 normal samples. The use of a balanced training set in machine learning is crucial for preventing the model from overfitting, and allows better generalization, more reliable performance metrics, and more informative feature importance rankings. The generalization ability of the different machine learning models was then checked using the second Brazilian dataset (GSE178216), which was generated using the same Illumina Infinium HumanMethylation450 BeadChip, as an independent dataset. The MLP-ml model achieved the best prediction accuracy on both the training examples and on the independent dataset, even with a reduced feature set of only the top 10 CpG sites. Interestingly, the first two CpG sites in the list correspond to the genes CCDC17 and SELI/SELENOI, which have already been implicated in various cancers [41, 42], including Squamous Cell Carcinoma (SCC) [43].
MLP models have been previously used to predict driver genes from multi-omics pan-cancer data, which included DNA methylation profiles [44], as well as risk of diabetes and cancer from DNA methylation arrays [45]. However, a major limitation of this study is the lack of experimental validation for the predictions made by the computational methods. In addition, this study focuses solely on DNA methylation; however, a more comprehensive model should also incorporate other epigenetic signals and correlate them with gene expression datasets to provide a holistic overview of the underlying mechanistic aspects of OSCC tumorigenesis and disease progression.
CONCLUSION
Overall, this study provided clues into salient methylation signatures unique to OSCC in South American patients, or more specifically, Brazilian patients, using two publicly available whole-genome methylation datasets and machine learning prediction models. The best-performing minimalistic MLP model used only the top 10 CpG sites to give an accuracy score of 100% on both the blind testing set and the second independent validation dataset. Similar studies are needed on methylation datasets from other South American countries to further validate this model and the methylation pattern associated with OSCC in our study.
AUTHORS’ CONTRIBUTIONS
The author confirms sole responsibility for the following: Study conception and design, data collection, analysis and interpretation of results, and manuscript preparation.
LIST OF ABBREVIATIONS
| OSCC | = Squamous Cell Carcinoma |
| SVM | = Support Vector Machine |
| RF | = Random Forest |
| MLP | = Multilayer Perceptron |
| NB | = Naïve Bayes |
| SVM-linear | = Support Vector Machines with Linear Kernel |
AVAILABILITY OF DATA AND MATERIALS
All the data and supporting information are provided within the article.
ACKNOWLEDGEMENTS
Declared none.