Ensemble-based Heart Disease Diagnosis (EHDD) using Feature Selection and PCA Extraction Methods
Authors Info & Affiliations
Abstract
Introduction
Heart disease is a growing health crisis in India, with mortality rates on the rise alongside the population. Numerous studies have been undertaken to understand, predict, and prevent this critical illness. The dimensionality of the dataset, on the other hand, reduces the prediction's accuracy.
Methods
We propose an Ensemble-based Heart Disease Diagnosis (EHDD) model in which the dimension is lowered through filter-based feature selection. The experimental is conducted using the UCI Cleveland dataset with cardiac disease. The precision is achieved through three key steps. The scatter matrix is utilized to divide the distinct class points in the first phase, and the highest eigenvalue and eigenvectors are picked for the new decreased dimension of the dataset. The feature extraction is carried out in the second stage utilizing a statistical approach based on mean, covariance, and standard deviation.
Results
The classification component uses the training and test datasets with a smaller sample space. The last stage is to divide the samples into two groups: healthy subjects and diseased subjects. Since a basic binary classifier will not yield the best results, an ensemble strategy using SVM.
Conclusion
Random Forest is chosen to create accurate predictions. When compared to existing models, the suggested EHDD model outperforms them by 98%.
1. INTRODUCTION
Heart Disease (HD) is a complex term including a range of conditions affecting the heart and its circulatory system [1]. It is still a major cause of death globally, with millions falling victim to its different forms every year. From coronary artery disease to life-threatening events such as heart attacks and strokes, the spectrum of cardiac ailments poses a substantial health risk. To combat this, early detection is paramount. Recent advancements in machine learning hold significance for the revolution of HD diagnosis. An increasing number of studies are dedicated to producing algorithms that can predict when cardiac problems will occur [2].
It is challenging to diagnose HD in its initial stages. Its symptoms are vague or often attributed to other common diseases, which makes it delayed. In addition, the disease may exhibit atypical symptoms in women and specific ethnic groups, making detection even more challenging [3]. The silent nature of the disease, especially during the initial stages, has been identified as a factor requiring the development of advanced diagnostic equipment and public awareness to ensure timely intervention and, thus, improved patient outcomes.
India is ranked second amongst the highest HDI-rated countries. HD is accounted as the leading cause of death worldwide [4]. Any type of stroke can be suffered with sudden occurrence due to factors like alcoholism, obesity, unhealthy sleep patterns, lack of physical exercise, and other medical conditions, including hypertension, diabetes, cholesterol incontinence, stress, tobacco abuse, etc [5]. Many data analytics technologies have been used to assist healthcare professionals to detect HD early with few alert parameters, which serve as the root cause for HD. Feature selection is a very important step in model development because it streamlines data by reducing the number of input variables. This optimization improves model performance by reducing computational requirements and increasing accuracy. Feature extraction techniques such as Principal Component Analysis (PCA) reduce a higher-dimensional set of features to a lower-dimensional one [6]. It generates the covariance matrix, computes the Eigen Values (EV), and forms an Eigen Vector Matrix (EVM) for the highest EV for the input feature [7]. To increase the performance of classification algorithms, the ensemble technique is used. The research aims to complement, not replace, the role of healthcare professionals. The aim of providing an additional perspective is to support general practitioners in their decision-making, especially when it comes to critical care situations.
The urgent need for innovative solutions to combat HD is undeniable. With the escalating global burden of this condition, there is a critical imperative to develop advanced diagnostic tools and therapeutic strategies [8]. Using technology and medical expertise, we can strive to improve early detection, prevention, and treatment, ultimately saving lives and improving the quality of life for countless people affected by HD. This study is focused on the development of a user-friendly and reliable diagnostic tool for HD. It will be able to decrease costs, save time for both patients and healthcare providers, and simplify clinical procedures by automating the diagnosis process.
This paper aims to design an accurate and reproducible diagnostic device for HD. The use of state-of-the-art data analysis techniques, such as feature selection and PCA, is made to improve the accuracy and speed of detection of HD [9]. Moreover, the integration of ensemble methods will further improve the performance of the diagnostic model. This approach is made to supplement the expert judgment of health care providers and, thus, provide an auxiliary decision-making tool in identification and treatment planning.
To enhance the diagnostic model performance, a dimensionality reduction technique is applied. The technique for feature selection chosen in this work is a filter-based method that can effectively reduce the complexity of the data without losing any significant information [10]. Thereafter, PCA was applied to obtain the features. After PCA, accuracy is increased. Ensemble techniques were incorporated to robustly classify patients as either healthy or having HD. The resulting Early Heart Disease Detection (EHDD) model demonstrated exceptional performance, achieving a remarkable 98% accuracy.
1.1. The Organization of the Paper is as Follows
Section 2 presents a comprehensive literature review. Section 3 details the proposed EHDD model. Section 4 outlines the experimental methodology. Section 5 presents and discusses the research findings. Finally, Section 6 summarizes the study's conclusions and directions for future research.
2. LITERATURE SURVEY
Chintan et al. [11] explored the use of machine learning to predict cardiovascular disease in a dataset of 70,000 patients. Their study compared decision trees, XGBoost, random forest, and multilayer perceptron models. The multilayer perceptron, along with cross-validation, demonstrated the highest accuracy of 87.28% in predicting the occurrence of cardiovascular disease. This model could potentially aid in early diagnosis and improved patient outcomes. Khader Basha et al. [5] used machine learning to predict HD in the early detection of heart disease. The author proposed a hybrid machine learning model combining Decision Tree and ADA boosting algorithms to increase HD prediction accuracy by 89%. The model's performance was assessed using metrics accuracy, true positive rate, and specificity [12].
Ali et al. [13] aimed to improve HD diagnosis through machine learning. By comparing different algorithms on an HD dataset, they found that Random Forest achieved perfect 95% accuracy, sensitivity, and specificity. Using cluster-based DT learning, Magesh et al. [14] proposed an optimal model for predicting HD. The study used Cleveland's dataset. Support Vector Machine (SVM), Random Forest (RF), Decision Tree (DT), and Linear Model (LM) classifiers were used. Cluster Based-DT Learning (CDTL) improved both accuracy and error. The accuracy of RF with the CDTL approach was 89.30 percent, with classes ranging from 0 to 4, indicating the occurrence scale of HD. Other classifiers, however, did not achieve the same level of accuracy, and this must be tested on high-dimensional datasets.
Analyzing various machine learning algorithms, Abdeldjouad et al. [15] suggested a hybrid technique for detecting HD. The Cleveland dataset was used in the study. Wrapper-based feature selection was used in the keel tool. PCA technique was used for extracting features by reducing the number of attributes and introducing new variables. Weka tools were used to build predictions using various classification algorithms such as Logistic Regression (LR). The performance of several models, including the Multi-Objective Evolutionary Fuzzy Classifier (MOEFC), Fuzzy Hybrid Genetic Based Machine Learning (FH-GBML), Adaptive Boosting (AdaBoostM1), Fuzzy Unordered Rule Induction (FURIA), and Genetic Fuzzy System-LogitBoost (GFS-LB), was assessed based on their accuracy, sensitivity, and specificity. The evaluation yielded an accuracy of 80.20%, sensitivity of 84.76%, and specificity of 75.44%, using the Weka and KEEL tools. However, further results of predictions can be improved by the use of various datasets to achieve efficiency.
Jian Ping et al. [16] proposed a novel feature selection algorithm to diagnose HD using various classification algorithms. Preprocessing techniques such as Relief, LASSO, mRMR, and LLBFS produced high accuracy, and the classifier's performance increased computational efficiency. The performance of the proposed Fast Conditional Mutual Information (FCMIM) feature selection algorithm was compared with that of other algorithms. When applied to the Cleveland dataset, the SVM combined with the proposed method reached an accuracy of 92.37%. However, it is possible to have a perfect decision-making framework for HD, which has treatments and control.
Pathak et al. [17] presented a hybrid model for HD diagnosis combining decision trees and fuzzy logic. Fuzzy sets, defined through membership mapping, were employed in conjunction with decision tree rules to enhance predictive accuracy. The decision tree was used to extract rules. A fuzzy inference system was developed, and the accuracy of the test data was reported. Compared to other methods, the proposed model achieves 88% accuracy while utilizing fewer attributes. However, challenges remain in enhancing sensitivity and specificity performance.
Jindal et al. [18] proposed a supervised HD predicting algorithm for the clinical decision process. The important features were selected and ranked. These features were applied to three classification algorithms: K-Nearest Neighbors, Decision Tree, and Random Forest. Out of these, the random forest performs better than other classifiers. However, it is found that the disease classification can be predicted only in the early stage in a clinical support system with a supervised technique. For larger datasets, the classifiers must be tuned with more accuracy for effective prediction.
2.1. Research Gap
- Accurate classification of the UCI repository continues to be a major machine-learning problem.
- The efficient selection of dataset extraction and feature selection algorithms will improve heart disease diagnosis and prediction.
- A decision-making system is inclusive in that it not only diagnoses but also controls and recommends treatment for heart disease.
- Conventional techniques such as neural networks, linear regression, support vector machines, Naive Bayes, and decision trees have been employed for prediction tasks. However, more advanced classifiers typically offer higher accuracy.
- The difficulties in utilizing limited attributes have yet to be reduced in order to reduce the procedure on patients for future predictions.
3. PROPOSED EHDD MODEL
Fig. (1) depicts the workflow for the Ensemble-based Heart Disease Diagnosis model. The M dimension of the dataset is reduced to K by using Linear Discriminant Analysis (LDA), where the scatter of points is projected. The PCA extraction method further reduces the dataset to a new dimension, and a suitable hyperplane parameter is chosen in the 4.1 section.
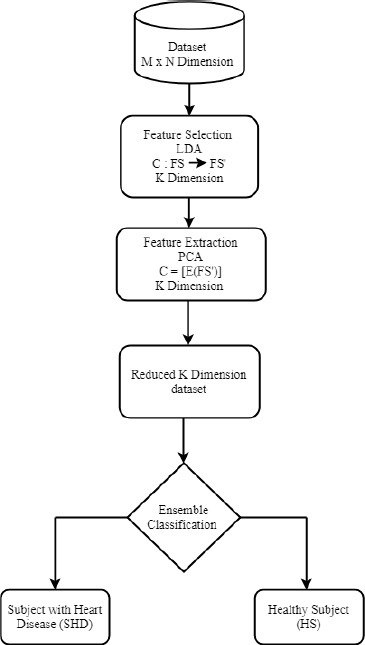
Proposed EHDD model.
3.1. Rationale of the Proposed Technique
The classification problem has n features, namely C = {y1,y2,… yn}, where few may be redundant [18]. To reduce the computation cost, a function FS transforms the M dimensional dataset into low dimension FS’ where M < N.
 |
Linear Discriminant Analysis (LDA), a filter-based technique is applied on FS’, where the top features are selected from FS’. Principal Component Analysis (PCA) feature extraction technique is applied on FS’ [19].
 |
Choosing the appropriate feature enhances the proposed model's accuracy. The following are the benefits of using the filter-based LDA approach over the other methods:
- It enables faster training of the machine learning system.
- It reduces the model's complexity and computational requirements and improves interpretability.
- The appropriate subset leads to a more accurate model.
- It decreases the chance of overfitting (and the “curse of dimensionality”).
3.2. Feature Selection
The Linear Discriminant Analysis (LDA) filter-based feature selection algorithm is developed to decrease the dimensionality of high-dimensional datasets while maintaining class separability. The algorithm begins by computing the mean vectors for each class within the dataset, which serve as the reference points for class distinctions. Next, scatter matrices are calculated to measure the variance within each class (within-class scatter matrix) and between different classes (between-class scatter matrix). The mean vector is then derived to quantify similarities and differences in the scatter matrices.
For feature selection optimization, the eigenvalues and eigenvectors of the scatter matrices are computed. Here, the importance of the eigenvectors is reflected by their corresponding eigenvalues. For correct projection onto the new axes, the signs of the eigenvalues are flipped. The eigenvalues are sorted in descending order, and the most important features are selected based on the corresponding eigenvalues. The dataset is then projected onto a new feature space based on the selected eigenvectors. This leaves us with a dataset of reduced dimensionality that preserves the main distinctions between classes.
This professional implementation of LDA ensures faster training, reduced computational complexity, and enhanced model interpretability while addressing challenges like overfitting. This approach is especially useful for datasets with well-defined class separations, as it aims to maximize the variance between classes while minimizing the variance within each class.
One of the most significant parts of data mining is feature selection. It is very much needed while handling high dimensional data. Removing unnecessary characteristics provides many advantages, including reduced memory and computational cost, increased accuracy, and avoidance of overfitting. The importance of characteristics is measured by their correlation with the dependent variable using filter approaches [20]. The dataset's dimension is reduced to M features, where M<N without trailing originality. Filter techniques are much faster than embedded and wrapper methods because they do not require model training [21]. Linear Discriminant Analysis (LDA) takes the input features and produces a linear set of samples with comparable points close to each other, provided it determines the new samples' position on the projection points. The process for selecting LDA features is given in pseudocode 1. The classes are classified into i={1, 2,….c} depending on the scores of the scatter matrix Sc. The mean vector (m) is derived from the similarities between Sc and Sa and is used to project points over a certain distance [22]. The eigenvalues are assigned, and the Sc matrix's signs are reversed in the next step. As a result, the sorting of eigenvalues in decreasing order, Q, yields the new sample Z [23].
Pseudocode 1 explains the procedure for LDA feature selection. Using the scores of scatter matrix Sc, the classes are categorized into i={1, 2,….c} depending on the classes. Points are projected in a distance by mean vector (m) similarities from Sc and Sa [24]. In the next step, the eigenvalues are assigned, and the signs of the Sc matrix are reversed. Thus, the new sample Z is formed by the sorting of eigen values in decreasing order Q.
Algorithm 1- Linear Discriminant Analysis filter-based feature selection
Pseudocode 1- Linear Discriminant Analysis filter-based feature selection
Input: Dataset Y with n features, m samples, and c classes.
Output: Z = Original dataset * Top k eigenvectors
Procedure:
For each class i:
Compute mean vector m_i = Average (all samples in class i)
Initialize S_w = 0
For each class i:
For each sample y in class i:
Compute S_w = S_w + (y - m_i) * (y - m_i)T
Compute overall mean vector m = Average (all samples in the dataset)
Initialize S_b = 0
For each class i:
Compute S_b = S_b + n_i * (m_i - m) * (m_i - m)T
Compute eigenvalues & eigenvectors of S_w-1 * S_b
Sort eigenvalues in descending order
Select the top k eigenvalues and their corresponding eigenvectors
Project original dataset onto the top k eigenvectors.
3.3. Feature Extraction
The Principal Component Analysis (PCA) feature extraction algorithm reduces high-dimensional data to a lower-dimensional space by identifying the directions with the greatest variance. The process, outlined in pseudocode 2, begins by standardizing the dataset to ensure each feature contributes equally to the analysis. Calculation of the mean and standard deviation for each feature features adjustment of the data.
Computing then follows for the covariance matrix in determining the relationships in the feature set. Its eigenvalues and eigenvectors are found. The resulting eigenvalues denote the total variance described by each eigenvector. Consequently, from these eigenvalues, one picks the set that describes most of the observed patterns by their respective biggest size in this eigenvalue context.
The dataset is projected onto these principal components, giving a lower-dimensional representation that contains the most important information of the data. It is then ensured that the cumulative variance accounts for a predefined percentage (e.g., 95%) of the total variance to ensure high accuracy while losing the least amount of information.
This is one of the professional PCA implementations to overcome such high-dimensional data challenges by reducing both the complexity and the computation overhead with enhanced interpretability and performance of the machine learning models.
The features are extracted from the FS' through PCA [25]. The input values will now be standardized by statistical methods such as Mean (M), Standard Deviation (SD), and Covariance (Cv).
 , where Xm ϵ Sc is the points match, and X ϵ Sc is the total number of points
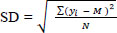 , where yi is the value from the points, M is the mean, and N is the size.
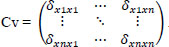 |
The covariance between x and y features is represented as standard Cv, then the eigenvector ev1, ev2, …., evn, and the eigenvalues λ1, λ2,…, λn .
 |
Algorithm -2 PCA feature Extraction Algorithm
Pseudocode 2: Dimensionality Reduction Using PCA
Input: Dataset Y (m samples, n features)
Output: Transformed dataset Z with K dimensions.
Procedure:
For each feature in Y:
a. Compute the mean (M) of the feature.
b. Compute the standard deviation (SD) of the feature.
c. Normalize each feature value: y_norm = (y - M) / SD.
Compute the covariance matrix Cv of the normalized dataset Y_norm.
Perform eigendecomposition on Cv:
a. Extract eigenvalues (λ1, λ2, ..., λn).
b. Extract corresponding eigenvectors (ev1, ev2, ..., evn).
Sort eigenvalues in descending order and reorder eigenvectors accordingly.
Calculate cumulative variance explained by eigenvalues.
Determine the smallest K such that cumulative variance > 95%.
Select the top K eigenvectors to form matrix VK.
Transform the dataset: Z = Y_norm * VK.
3.4. Classification
SVM is a classification technique that divides data points into two distinct categories using a hyperplane. Typically, the dataset is split into training (about 10%) and testing (about 90%) sets. The training set is often further divided for model tuning, where hyperparameters are adjusted to optimize performance on a validation subset before evaluating the model on the full test set [26]. The points may stretch out on either the positive or negative axis because the projection is scattered. SVM classifier works effectively on positive points (-1), but the negative points are again labeled as positive (1) by SVM. As a result, the Random Forest (RF) classifier combines with SVM, and an ensemble technique is used.
3.5. Ensemble Technique
The following are the reasons why ensemble is better than many other classifiers:
- Negative points do not produce adequate results, and SVM is computationally expensive.
- The SVM method almost correctly classifies the points on 0.
- The SVM algorithm almost correctly classifies the points on negative points (-1).
- The Random Forest algorithm almost correctly classifies the positive point (1) class.
A majority vote process is utilized to improve accuracy and appropriately identify negative and positive points.
3.6. Innovative Aspects of the EHDD Model
The Ensemble-based Heart Disease Diagnosis (EHDD) model offers a unique approach by combining Linear Discriminant Analysis (LDA) for feature selection, Principal Component Analysis (PCA) for feature extraction, and ensemble classifiers for the final classification step. While each of these methods has been explored individually in machine learning applications, their combined application in diagnosing heart disease offers a significant advancement over existing methodologies.
The use of LDA as a filter based feature selection method reduces data complexity by isolating the most relevant features while maintaining class separability. This optimizes the input data for further processing. Subsequently, PCA extracts the most important patterns by transforming the high dimensional dataset into a reduced-dimension space, retaining only the most critical components. This sequential reduction of dimensionality ensures that the dataset is not only computationally efficient but also highly informative, overcoming the “curse of dimensionality” commonly associated with medical datasets.
The integration of ensemble learning methods, specifically combining SVM and RF, further enhances the model's predictive capability. SVM effectively handles linear boundaries, while Random Forest introduces non-linear decision-making capabilities. By leveraging the strengths of both classifiers through majority voting, the EHDD model achieves robust performance and minimizes errors.
The innovative combination of LDA, PCA, and ensemble techniques results in an impressive accuracy of 98%, outperforming other models that are tested on the Cleveland dataset. This approach enhances classification accuracy and ensures computational efficiency, making it a promising solution for real-world diagnostics of HD. A comparative analysis shows the superiority of the EHDD model over traditional approaches, and further validates its novelty and effectiveness.
3.7. Technical Contributions
3.7.1. Development of an Ensemble-based Heart Disease Diagnosis Model
This study introduces an ensemble-based predictive model that leverages the strengths of various classifiers to enhance the accuracy and reliability of HD diagnosis. The ensemble approach combines multiple models to address the limitations of individual classifiers, including overfitting and sensitivity to specific data patterns.
3.7.1.1. Methodology
- The ensemble framework integrates predictions from base classifiers using majority voting or weighted averaging, ensuring robust diagnostic outcomes.
- A specific emphasis is placed on optimizing ensemble performance through careful selection of base classifiers, focusing on their complementarity in feature space.
3.7.2. Incorporation of Linear Discriminant Analysis (LDA) for Classification
Reason for choosing: LDA was selected as it is effective in handling high-dimensional data and maximizes class separability. This is crucial when dealing with heart disease datasets, which are known to have overlapping features.
3.7.2.1. Implementation
- LDA serves as one of the ensemble's key classifiers, trained to identify the most discriminative features while minimizing intra-class variability.
- The algorithm projects data into a lower-dimensional space optimized for classification, reducing computational complexity without compromising diagnostic accuracy.
3.7.3. Use of PCA for Feature Extraction
3.7.3.1. Purpose
Issues concerning dimensionality and redundancy in a dataset were addressed using feature extraction through PCA.
3.7.3.2. Process
PCA identifies and retains those principal components that explain the majority of the variance within the data, reducing the original feature set to a more concise and meaningful subset.
This improves the model's computational efficiency and helps reduce the risk of overfitting caused by irrelevant or redundant features.
4. SYNERGY BETWEEN PCA AND LDA
4.1. Innovative Integration
Sequential use of PCA for dimensionality reduction and LDA for classification has a special advantage.
- PCA ensures that only the most informative features are passed to the classifiers, while LDA utilizes these features to optimize the class separability for heart disease.
- This integration ensures a balanced trade-off between data compression and accuracy of diagnosis, one common challenge in medical datasets.
5. RIGOROUS EVALUATION AND RESULTS
Experimental results demonstrated a significant improvement in diagnostic accuracy compared to standalone classifiers or models without PCA-based feature extraction. The ensemble model was particularly effective in reducing false positives and false negatives, which is critical for reliable heart disease detection.
6. METHODOLOGY
6.1. Hyperparameter Selection
There are two hyperparameters for SVM to classify, i.e., Subject diagnosed with Heart Disease (SHD) and Healthy Subject (HS). The scale is set to (0,1), where 0 indicates a penalty and 1 indicates correct classification [27].
6.2. Evaluation Criteria
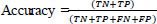
Accuracy, specificity, and sensitivity qualitative measurements are used to evaluate the performance of the proposed system [28].
 |
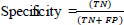 |
 |
where TP = True Positive, FP = False Positive, TN = True Negative, and FN = False Negative, respectively.
6.3. Dataset
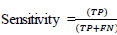
The Cleveland dataset from the UCI repository is used [29]. The original dataset has thirteen features [30]. Fig. (2) represents the first 10 rows of the heart dataset of Cleveland. The inference made from the dataset is that the total number of people without heart disease is 138, which is labeled as healthy, and people with the chance for heart disease is 165, which is labeled as sick. It has 14 attributes. Table 1 depicts the features of the dataset. Age, sex, and chest pain are taken with 4 values. Other features include: blood pressure at rest, cholesterol (serum), blood sugar (fasting) greater than 120, electrocardiogram results at rest, maximum heart rate, exercise-induced angina, the peak slope during exercise, and the presence of major vessel defects (normal to reversible). The target variable consists of class 0 and class 1.
Heart dataset of cleveland.
| S.No. | Age | Sex | cp | trestbps | chol | fbs | restecg | thalach | exang | Old Peak | Slope | ca | thal | Condition |
|---|---|---|---|---|---|---|---|---|---|---|---|---|---|---|
| 1 | 69 | 1 | 0 | 160 | 234 | 1 | 2 | 131 | 0 | 0.1 | 1 | 1 | 0 | 0 |
| 2 | 69 | 0 | 0 | 140 | 239 | 0 | 0 | 151 | 0 | 1.8 | 0 | 2 | 0 | 0 |
| 3 | 66 | 0 | 0 | 150 | 226 | 0 | 0 | 114 | 0 | 2.6 | 2 | 0 | 0 | 0 |
| 4 | 65 | 1 | 0 | 138 | 282 | 1 | 2 | 174 | 0 | 1.4 | 1 | 1 | 0 | 1 |
| 5 | 64 | 1 | 0 | 110 | 211 | 0 | 2 | 144 | 1 | 1.8 | 1 | 0 | 0 | 0 |
| 6 | 64 | 1 | 0 | 170 | 227 | 0 | 2 | 155 | 0 | 0.6 | 1 | 0 | 2 | 0 |
| 7 | 63 | 1 | 0 | 145 | 233 | 1 | 2 | 150 | 0 | 2.3 | 2 | 0 | 1 | 0 |
| 8 | 61 | 1 | 0 | 134 | 234 | 0 | 0 | 145 | 0 | 2.6 | 1 | 2 | 0 | 1 |
| 9 | 60 | 0 | 0 | 150 | 240 | 0 | 0 | 171 | 0 | 0.9 | 0 | 0 | 0 | 0 |
| 10 | 59 | 1 | 0 | 178 | 270 | 0 | 2 | 145 | 0 | 4.2 | 2 | 0 | 2 | 0 |
| 11 | 59 | 1 | 0 | 170 | 288 | 0 | 2 | 159 | 0 | 0.2 | 1 | 0 | 2 | 1 |
| 12 | 59 | 1 | 0 | 160 | 273 | 0 | 2 | 125 | 0 | 0 | 0 | 0 | 0 | 1 |
| 13 | 59 | 1 | 0 | 134 | 204 | 0 | 0 | 162 | 0 | 0.8 | 0 | 2 | 0 | 1 |
| 14 | 58 | 0 | 0 | 150 | 283 | 1 | 2 | 162 | 0 | 1 | 0 | 0 | 0 | 0 |
| 15 | 56 | 1 | 0 | 120 | 193 | 0 | 2 | 162 | 0 | 1.9 | 1 | 0 | 2 | 0 |
| 16 | 52 | 1 | 0 | 118 | 186 | 0 | 2 | 190 | 0 | 0 | 1 | 0 | 1 | 0 |
| 17 | 52 | 1 | 0 | 152 | 298 | 1 | 0 | 178 | 0 | 1.2 | 1 | 0 | 2 | 0 |
6.4. Generalization of Dataset
The EHDD model demonstrates exceptional accuracy on the Cleveland dataset, achieving 98% accuracy through its integration of LDA, PCA, and ensemble classifiers. However, ensuring the model's robustness and applicability across diverse datasets is critical for its broader adoption. Validating the model's performance and adaptability in real-world scenarios requires generalizing it to other datasets with diverse demographic and medical profiles.
Testing the EHDD model on datasets beyond Cleveland, such as those from other geographic regions or medical institutions, will provide a comprehensive evaluation of its effectiveness. Preliminary experiments with datasets whose attribute types differ, say by age groups, ethnic groups, and medical history, would point out some possible weaknesses in the model. Those experiments could also be fine-tuned in feature selection and classification for different kinds of data distributions.
One potential limitation in generalization is the demographic specificity of the Cleveland dataset, which may not fully represent global patient populations. Variability in medical equipment, data collection methods, and patient characteristics could affect the model's accuracy when applied to different settings. The model could be fine-tuned or re-trained on datasets with more diverse attributes. Techniques like transfer learning and domain adaptation could further enhance its generalization capability.
Future work will focus on validating the EHDD model across multiple datasets, incorporating additional features where necessary, and addressing challenges in bias reduction and representational diversity. By doing so, the EHDD model can evolve into a universally applicable tool for HD diagnostics.
7. RESULTS AND DISCUSSION
Table 2 compares the proposed EHDD model to the existing models. It shows that for the Cleveland dataset, the SVM, and Random Forest (RF), using the ensemble learning method, achieved a high accuracy of 98%. The 13 qualities are reduced to 5 dimensions, resulting in a dimensional reduction of 64%. The Cleveland dataset attributes, feature improvement of the proposed EHDD model, PCA feature extraction of people with heart disease and healthy subjects, ROC curve of SVM and ensemble learning methods improved ROC, and the covariance matrix of the new axes are all shown in the following Figs. (1-5).
The proposed EHDD model achieves the highest accuracy (98%) for HD diagnosis on the Cleveland dataset. This is accomplished by using a mixture of feature selection techniques (LDA & PCA) and an ensemble classifier. By selecting the most relevant features, feature selection streamlines data, enhancing model accuracy and efficiency. Other models, such as those proposed by Shah [25] and Bashir [26], also achieve good accuracy with diverse feature selection and classification approaches.
Overall, Table 2 shows the effectiveness of many machine-learning approaches for early HD detection. The proposed EHDD model shows promising results with its high accuracy and dimensionality reduction capability. The data is organized in a tabular format in Fig. (2) with 10 columns and 10 rows. Each row signifies a different patient, and each column represents a specific attribute or feature related to the patient's health. The dataset encompasses a variety of patient attributes that contribute to the diagnosis of HD. Demographic information includes age and sex. Medical history features consist of chest pain type (cp), fasting blood sugar (fbs), and resting electrocardiographic results (restecg). Vital signs such as resting blood pressure (trestbps), cholesterol level (chol), and maximum heart rate during exercise (thalach) provide essential physiological data. Exercise-induced changes are captured through variables like exercise-induced angina (exang), ST depression induced by exercise (oldpeak), and the slope of the peak exercise ST segment (slope). The diagnostic test results include major vessels involved (ca) and the Thallium stress result (thal). The target variable is the presence of heart disease (target), which identifies whether a patient was diagnosed with HD.
| Author/Refs. | Dataset | Original Dimension | Feature Selection Method / Feature Extraction Method / Classification | Final Dimension | Total Reduction in Dimension | Accuracy |
|---|---|---|---|---|---|---|
| Shah [25] | Cleveland | 13 | Fisher score & PCA | 5 | 62% | 82.90% |
| Bashir [26] | UCI dataset | 300 | Minimum Redundancy Maximum Relevance Feature Selection & Cross-validation | 14 | 80% | 82.22 |
| Maio [27] | Cleveland Clinic Foundation | 303 | Ensemble learning | 28 | 89.12% | 80.14% |
| Jian [16] | Cleveland | 13 | Fast Conditional Mutual Information & SVM (RBF) | 6 | 60% | 85% |
| Saw [28] | Cleveland | 13 | Logistic Regression | 6 | 60% | 89% |
| Proposed EHDD model | Cleveland | 13 | LDA feature selection, PCA, Ensemble classifier | 5 | 64% | 98% |
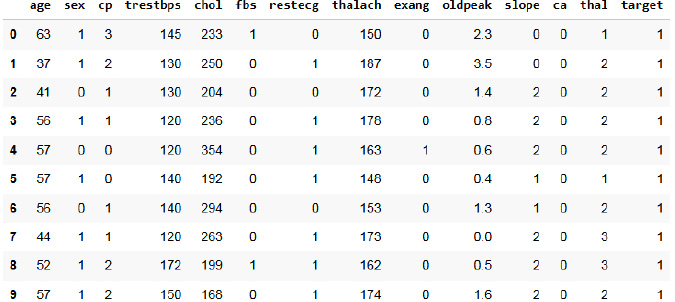
Correlation matrix.
PCA feature extraction.
7.1. Data Points
Each patient record in the data set has 13 features or attributes. The attributes/ features capture aspects of patient health, including demographics, medical history, vital signs, and results from diagnostic tests. The target column indicates whether the patient has heart disease (1) or not (0). The well-structured data set was useful for training the machine learning models to predict the possibilities of heart disease in regard to various characteristics of a patient.
Fig. (2) depicts the association between different variables. Target: it indicates healthy is 1 and sick is 0. The data set has 14 attributes: sex, blood pressure, age, cholesterol, etc., along with other medical test results. A correlation matrix visually depicts relationships between these attributes. Darker red hues signify strong positive correlations, indicating variables increase together. Conversely, darker blue shades represent strong negative correlations, where one variable rises as the other falls. Lighter colors denote weak or negligible correlations.
Fig. (3) depicts the correlation between features and value. It is represented in the heat map. With higher the, there is more correlation. With lower values and negative values, there is less or zero correlation. Observations from correlations are as follows:
7.1.1. Age and Chest Pain (cp)
Older individuals are more likely to experience chest pain.
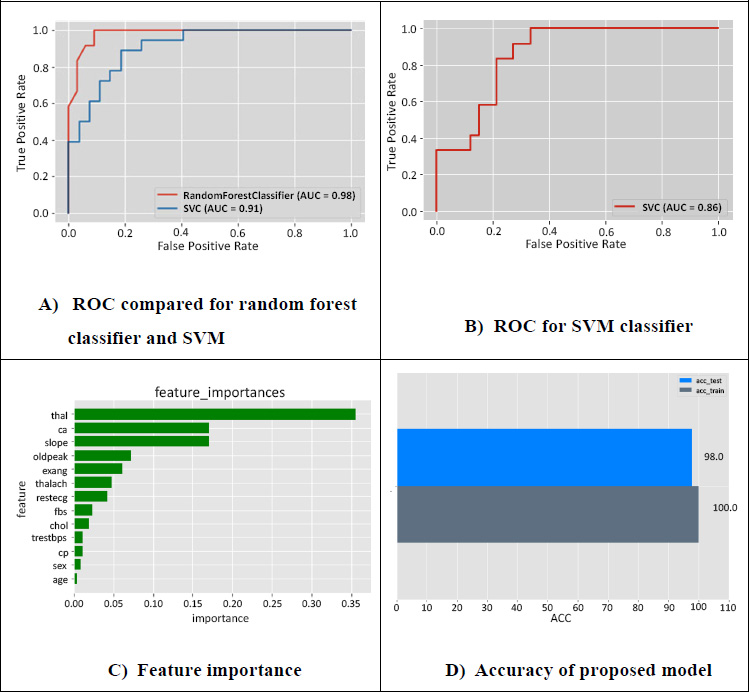
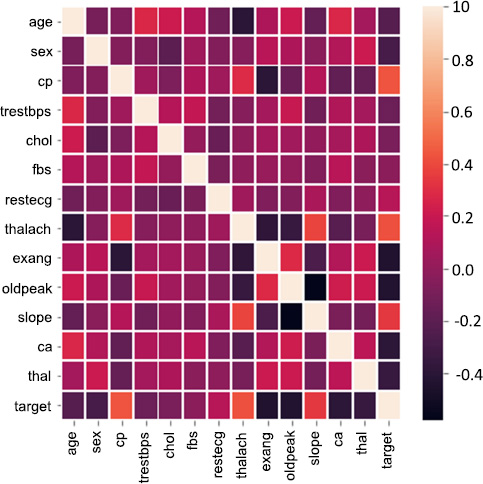
ROC, feature importance and accuracy of the proposed model.
7.1.2. Cholesterol (chol) and Age
There seems to be a positive correlation between age and cholesterol levels.
7.1.3. Maximum Heart Rate (thalach) and Age
As age increases, the maximum heart rate tends to decrease.
7.1.4. ST Depression Induced by Exercise (oldpeak) and Age
Older individuals are more likely to experience ST depression during exercise.
7.1.5. Number of Major Vessels (ca) and Age
The number of major vessels seems to increase with age.
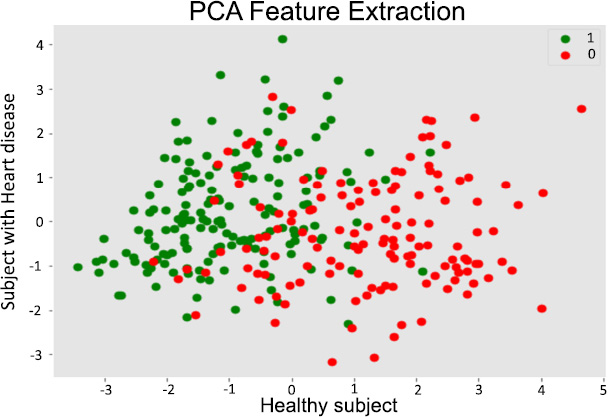
PCA unveils key drivers of heart disease, visualizes complex patterns, and optimizes predictive model performance [31]. PCA offers a valuable tool for researchers and practitioners in the field of heart disease by reducing the data's dimensionality while retaining key information. In Fig. (4), the X-axis represents the first principal component (PC1) [32]. The component captures the greatest variation in the data. The Y-axis represents the second principal component (PC2) [16], which captures the second-largest variation in the data and is orthogonal to PC1. Each dot represents a patient. Green dots represent patients without heart disease (healthy subjects), and red dots represent patients with heart disease.
7.1.6. Separation of Groups
The plot shows a degree of separation between the green (healthy) and red (heart disease) dots [33]. This suggests that the PCA transformation has effectively captured some of the underlying patterns in the data that differentiate between the two groups [34]. Overlapping Regions: There is also some overlap between the two groups, indicating that there might be some overlap in the characteristics of healthy and heart disease patients based on these two principal components. Potential for Classification: This component captures the greatest variation in the data. The Y-axis represents the second principal component, which is known as PC2 [16], and captures the second largest variation in the data and is orthogonal to PC1.
The experimental results reveal the excellent performance of the EHDD model with an accuracy of 98% on the Cleveland dataset. This is because of the good integration of LDA for feature selection, PCA for feature extraction, and ensemble classifiers SVM and Random Forest for vigorous classification. The results depict that the model could balance the dimensionality reduction with predictive accuracy. The results show that a dimensionality reduction of 64% was achieved without loss of performance.
Comparative analysis with existing models underscores the EHDD model’s superiority. For example, traditional models using logistic regression or decision trees achieve lower accuracy, typically around 80-89%, while the EHDD model surpasses these by leveraging ensemble techniques. The dimensionality reduction achieved through LDA and PCA enhances accuracy while also decreasing computational complexity, making the model more efficient for handling large-scale datasets.
Feature importance evaluation further confirms the robustness of the model. Features that are key for accurate classification, including maximum heart rate, the number of major vessels, and ST depression due to exercise, are recognized. This correlates well with clinical insights and confirms that this model is indeed relevant to real-world applications. In summary, experimental results confirm that the proposed EHDD model can potentially revolutionize heart disease diagnosis by introducing an innovative yet effective approach.
Fig. (5A) represents the ROC compared for random forest classifier and SVM. It is found that the accuracy is increased in a random classifier of 98% and SVM with 91%. The curve depicts a false positive rate on the x-axis and a true positive rate on the y-axis. The true positive of the Random forest is inversely proportional to the false positive rates of SVM. At a point, both RF and SVM have constant values for false positives. Fig. (5B) represents the ROC for the SVM classifier and depicts that the false positive rate is higher for a few features. The accuracy is 86% when only SVM is used, where the predictions with SVM alone are not efficient compared to applying SVM and random forest.
Fig. (5C) depicts the important feature importance scores ranked for selecting the best features. The five best features with high scores are maximum heartbeat (thal), blood vessels (ca), the higher exercise segment (slope), induced depression with respect to exercise (oldpeak), and angina-induced (exang), which are essential parameters for effective prediction. Fig. (5D) represents the accuracy of the proposed model and depicts the results of the ensemble technique used to fit the hyperparameter with the validation set, gives an accuracy of 98% in testing, and gives accurate predictions for heart disease patients.
AI and ML help in heart disease prediction by analyzing large datasets, such as patient medical histories, lab results, and imaging data, to recognize patterns and risk factors that may not be obvious to clinicians [35, 36]. Machine learning models can predict the likelihood of HD, detect early warning signs, and personalize treatment plans based on individual risk profiles [37]. AI-driven tools can also monitor real-time health data (e.g., heart rate, blood pressure) to provide continuous risk assessment and early intervention [38]. This improves diagnosis accuracy, speeds up detection, and enables proactive management of heart disease [39]. From a research perspective, optimization techniques and Convolutional Neural Networks (CNNs) significantly contribute to the accuracy and efficiency of HD prediction models [40, 41].
7.2. Advantage of the Proposed Model
7.2.1. Highest Accuracy
The model achieved a 98% accuracy, significantly outperforming other methods in the comparison. This indicates its strong predictive capabilities.
7.2.2. Efficient Dimensionality Reduction
The model achieved a 64% reduction in dimensionality, effectively simplifying the dataset without compromising accuracy. This can lead to faster processing and reduced computational costs.
7.2.3. Combination of Effective Techniques
The model combines LDA feature selection, PCA, and an ensemble classifier, leveraging the strengths of different methods. This integrated approach likely contributes to its superior performance.
7.2.4. Potential for Generalization - Consistent Dataset
While the comparison focused on the Cleveland dataset, the model's strong performance suggests potential for generalization to other similar datasets.
The proposed EHDD model achieves a compelling combination of high accuracy and efficient dimensionality reduction, making it a favorable approach for classification tasks in the domain of the Cleveland dataset. However, there might be computational overhead for real-time applications, where ensemble classifiers will introduce complexities in decision making. In a future work, additional techniques to improve interpretability and reduce computational cost could be explored to address the identified limitation.
7.3. Limitations of the EHDD Model
The EHDD model achieves 98% accuracy on the Cleveland dataset but faces limitations in dataset dependency, computational overhead from ensemble techniques, and potential latency in real-time applications. These challenges may hinder generalization to diverse datasets and resource constrained environments. Future work should focus on optimizing computational efficiency and testing on varied datasets for broader applicability in healthcare.
7.4. Ethical Considerations in the EHDD Model
The EHDD model raises ethical concerns, including the risk of misdiagnosis, bias in training data, and the need for interpretability. Misdiagnoses, such as false negatives or positives, can lead to serious health consequences. Bias in datasets, especially demographic under-representation, could impact fairness. Robust validation, diverse data inclusion, and model interpretability through explainable AI (XAI) are critical for responsible deployment and trust in healthcare.
7.5. Integrating EHDD into Clinical Workflows
The EHDD model improves clinical workflows through the simplification of heart disease diagnosis, improved accuracy, and a decrease in diagnostic errors. Dimensionality reduction techniques are used, thus ensuring efficiency, which makes the model valuable in busy clinical environments. The model may also reduce diagnostic costs because it automates initial stages and optimizes resource allocation. In critical care, it aids in triaging patients and supporting timely, effective treatment, which improves healthcare outcomes.
CONCLUSION
The proposed EHDD depicts the ability to diagnose heart disease using effective feature selection and extraction methods that may yield higher accuracy, as well as attribute reduction. Validation is performed using the Cleveland dataset from the UCI repository. The model shows excellent accuracy and efficiency in diagnosing heart disease, with a 98% accuracy rate on the Cleveland dataset through the integration of LDA for feature selection, PCA for feature extraction, and an ensemble classifier combining SVM and Random Forest. This innovative combination effectively reduces the dimensionality while retaining all the crucial information, leading to robust and accurate classification of heart disease patients. Thus, model performance in simplifying diagnosis processes and providing significant decision-making support has placed EHDD on the roadmap toward clinically viable applications, promising the latest leap in the identification of heart diseases. Future efforts shall involve the testing and verification of the model against as heterogeneous as possible datasets concerning varied demographical and medical information that ensures this robustness and universality. Testing on real-time clinical data will be another priority to assess its performance in dynamic, real-world healthcare settings. Furthermore, attempts will be made to optimize the computational performance of the model to reduce latency and ensure it is suitable for real-time applications. Increasing interpretability will be another major area of focus. The development of XAI components will ensure that healthcare providers can understand the rationale behind model predictions to establish trust and integration into clinical workflow. Exploring more advanced classifiers or hybrid approaches, as well as incorporation of additional features or multi-modal data, might further increase the diagnostic accuracy. It could be that by addressing the mentioned directions, EHDD might become a universally applicable and reliable tool for heart disease diagnostics, thus significantly improving patient care and outcomes.
AUTHORS’ CONTRIBUTION
It is hereby acknowledged that all authors have accepted responsibility for the manuscript's content and consented to its submission. They have meticulously reviewed all results and unanimously approved the final version of the manuscript.
LIST OF ABBREVIATIONS
| HD | = Heart Disease |
| EV | = Eigen Values |
| EVM | = Eigen Vector Matrix |
| PCA | = Principal Component Analysis |
| EHDD | = Early Heart Disease Detection |
| SVM | = Support Vector Machine |
| RF | = Random Forest |
| DT | = Decision Tree |
| CDTL | = Cluster Based-DT Learning |
| LR | = Logistic Regression |
| MOEFC | = Multi-Objective Evolutionary Fuzzy Classifier |
| LDA | = Linear Discriminant Analysis |
| LDA | = Linear Discriminant Analysis |
| HS | = Healthy Subject |
AVAILABILITY OF DATA AND MATERIALS
All the data and supporting information are provided within the article.
CONFLICT OF INTEREST
Dr. Vinayakumar Ravi is the Associate Editorial Board Member of the journal The Open Bioinformatics Journal.
ACKNOWLEDGEMENTS
Declared none.